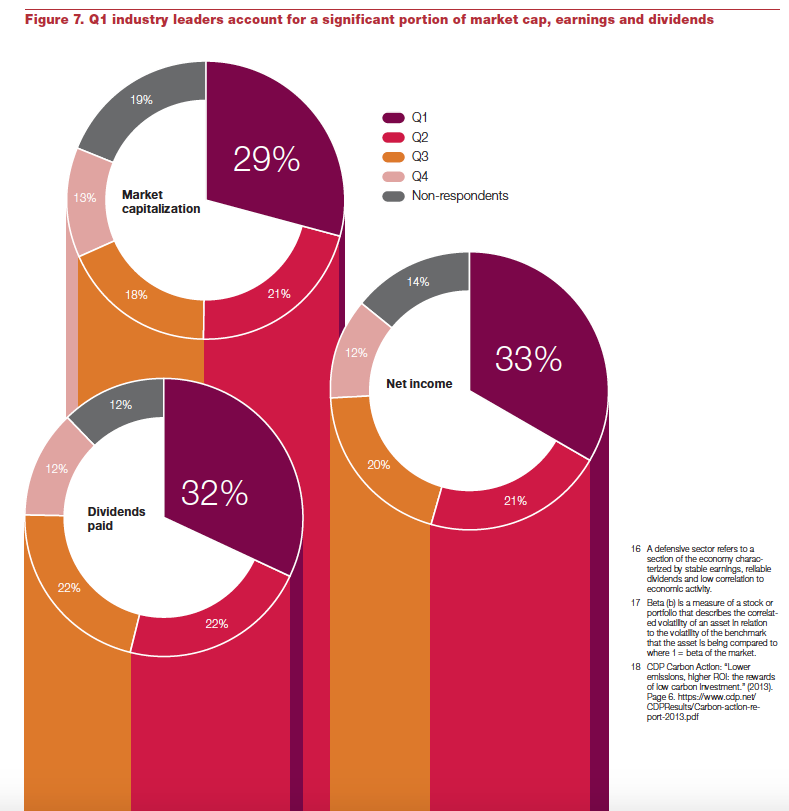
This chart compares industry leaders vs. the rest of the pack, in three different areas. I chose three donut chars to represent the data. Each comprises a whole. You can easily compare both within each donut, and across the three charts.
Data Visualization & Infographics
Data Visualization & Infographics